


How We Die PART I
Notes
How likely are we to die as infants? as teenagers? in our twenties, thirties, forties and fifties? in old age? What's most likely to kill us at each of these times of our lives? accidents? suicide? cancer? How, ultimately, do we die?
Most of what we know about death is anecdotal: a friend dies of cancer at a cruelly early age; an elderly relative with Alzheimer's is in slow decline.
The Internet only adds confusion: the news media is fleetingly obsessed with teenage suicide; social media is suddenly awash with diabetes awareness.
Of course, there are statistics: table after table of death rates published by the government, broken down by age, gender, race… but it's difficult to make sense of all those numbers.
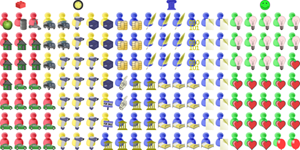
This visualization aims to give a better sense of how we die. It shows up to 1000 people, from newborns to centenarians: people are born on the left, and move to the right as they grow older. When someone dies, a symbol appears to show the cause of death: a heart disease, a brain disease, suicide, homicide or cancer.
As you'll see from the left side of the visualization, most people survive to the age of 50: very few of us die in childhood; accidents, suicides and (these being US statistics) homicides start to creep in as we reach adulthood; tragically, despite significant reductions in infant mortality over the years, neonatal and congenital conditions still claim a few of us before we reach our first year.
This picture changes dramatically on the right side of the visualization. Slowly, the two biggest killers – heart disease and cancer – begin to claim us. Few of us remain on the far right edge, at age 100, where the diseases of old age – strokes, Alzheimer's, Parkinson's – take their toll.
This first of two visualizations of how we die emphasizes the element of chance. No matter how long you look, you'll never see the same visualization: sometimes you'll see an unusually high rate of infant mortality; other times you'll see more suicides and homicides.
Make sure you check out the second visualization, too, How We Die PART II, which focuses on which causes of death are most lethal as you go through your life.
Subscribe now and I’ll let you know whenever I create a new visualization
It’ll only be every couple of months or so, I won’t let anyone else have your email address, and you can unsubscribe at any time
Thanks for subscribing!
Check your inbox for an email to confirm your subscription
Oh no, something went wrong, and I was unable to subscribe you!
Please refresh your browser and try again
Key
heart diseasesDiseases of heart (I00-I09,I11,I13,I20-I51) | |
cancerMalignant neoplasms (C00-C97) In situ neoplasms, benign neoplasms and neoplasms of uncertain or unknown behavior (D00-D48) | |
brain diseasesCerebrovascular diseases (I60-I69) Alzheimer's disease (G30) Parkinson's disease (G20-G21) | |
respiratoryChronic lower respiratory diseases (J40-J47) Pneumonitis due to solids and liquids (J69) Atelectasis (P28.0-P28.1) | |
accidentsAccidents (unintentional injuries) (V01-X59,Y85-Y86) | |
infectionsInfluenza and pneumonia (J09-J18) Septicemia (A40-A41) Human immunodeficiency virus (HIV) disease (B20-B24) Viral hepatitis (B15-B19) | |
diabetesDiabetes mellitus (E10-E14) | |
kidney diseasesNephritis, nephrotic syndrome and nephrosis (N00-N07,N17-N19,N25-N27) | |
liver diseasesChronic liver disease and cirrhosis (K70,K73-K74) | |
high blood pressureEssential hypertension and hypertensive renal disease (I10,I12,I15) | |
suicideIntentional self-harm (suicide) (*U03,X60-X84,Y87.0) | |
homicideAssault (homicide) (*U01-*U02,X85-Y09,Y87.1) | |
executionsLegal intervention (Y35,Y89.0) | |
circulatoryAnemias (D50-D64) Atherosclerosis (I70) Aortic aneurysm and dissection (I71) Diseases of the circulatory system (I00-I99) | |
diarrheaDiarrhea and gastroenteritis of infectious origin (A09) | |
congenital conditionsCongenital malformations, deformations and chromosomal abnormalities (Q00-Q99) | |
neonatal conditionsDisorders related to short gestation and low birth weight, not elsewhere classified (P07) Newborn affected by maternal complications of pregnancy (P01) Sudden infant death syndrome (R95) Newborn affected by complications of placenta, cord and membranes (P02) Bacterial sepsis of newborn (P36) Respiratory distress of newborn (P22) Neonatal hemorrhage (P50-P52,P54) Necrotizing enterocolitis of newborn (P77) Intrauterine hypoxia and birth asphyxia (P20-P21) Certain conditions originating in the perinatal period (P00-P96) | |
pregnancy/childbirthPregnancy, childbirth and the puerperium (O00-O99) | |
other causes not in the 15 leading causes for each age groupAll other causes (residual) |
Sources
This visualization is based on US data from the National Center for Health Statistics for 2014. However, death rates for age groups over 85 years are omitted from this data (why? is the NCHS too squeamish to admit that death rates are pretty high as you approach 100 years old?)
So I estimated the death rates for all causes for age groups over 85 years by extrapolating from the death rates for all causes for age groups 5 - 9 years through 80 - 84 years (i.e. excluding the higher death rates for infants 0 - 1 years and children 1 - 4 years) with an order-6 polynomial trendline.
As a sanity check, I confirmed that the resulting death rates (10,667.226 for 85 - 89 years, 17,754.8784 for 90 - 94 years and 29,025.4084 for 95 - 99 years were more or less consistent with an overall death rate of 12,634.8 for all age groups over 85 years, based on Canadian data from Statistics Canada for 2009.
Images
The Noun Project – asianson.design – person
The Noun Project – Yo Szczepanska – baby
The Noun Project – Travis Avery – Triangle Exclamation
The Noun Project – Kenton Quatman – DNA
The Noun Project – ProSymbols – Pistol
The Noun Project – Vladimir Belochkin – Lungs
The Noun Project – Daniela Baptista – Faeces
The Noun Project – Mithun Raju – Cancer
The Noun Project – Mello – Heart
The Noun Project – Creative Stall – Bacteria
The Noun Project – Creative Stall – Brain
The Noun Project – Andrejs Kirma – Noose
The Noun Project – Hea Poh Lin – Blood Cell
The Noun Project – arif fajar yulianto – Pancreas
The Noun Project – Mark S Waterhouse – Pregnancy
The Noun Project – Anton Gajdosik – Guillotine
The Noun Project – Delwar Hossain – Hepatology
Date
First published 3 October 2017
Comments
Click here to leave a comment
Thanks for your comment!
I’ll check it and put it live as soon as I can
Oh no, something went wrong, and I was unable to post your comment!
Please refresh your browser and try again
Isaac ⋅ 20 May 2021
It's kinda cool to see that up to about 65 almost everyone survives, then theres a period of maybe 25 years where about half of the people die. I've never thought about it that way before.
Mark Jeffery ⋅ 22 May 2021
Yes. Retire before you're 65 if you can!